Design Qualities: Data and Statistics
In my ever going (apparently never ending as well) pursuit to produce better designs, I got my head wrapped around the idea of: “Comparing the conceptual design input with the physical design output.“.
Now obviously from a business requirements perspective, if those conditions are met and the business goals are achieved, then definitely the overall architecture served its purpose. However, what I’ve been looking for is more of a data driven results that one could rely on to see the emphasis of which design quality in terms of:
- Availability
- Manageability
- Performance
- Recoverability
- Security
- Scalability
To this end I will be working on the frequency of design qualities to be able to produce some representable data.
We start of by using the data from the conceptual design, namely solution requirements where each requirement is categorized to touch on one of the design qualities and we have the hereunder results:
| Design Quality | Design Quality Emphasis |
| Availability | 17 |
| Manageability | 19 |
| Performance | 9 |
| Recoverability | 8 |
| Security | 10 |
| Scalability | 5 |
Based on the results, I created a pie chart based on a % measurement criteria.
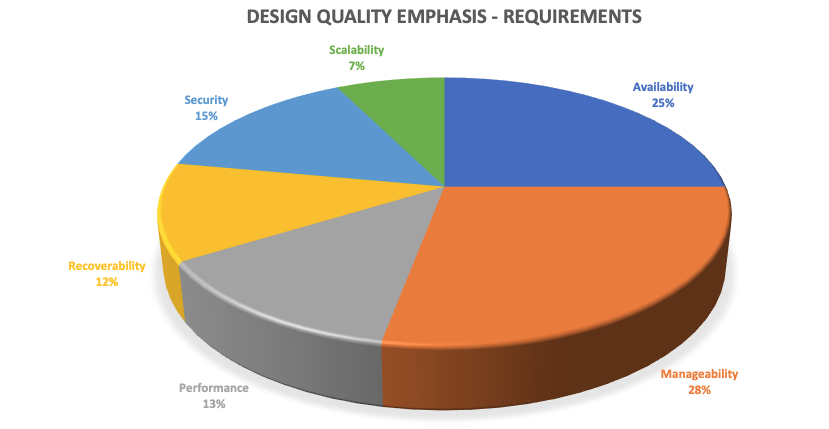
Now we have an idea on the areas of emphasis and we can see that from a priority perspective we have:
| Design Quality | Percentage |
| Manageability | 28% |
| Availability | 25% |
| Security | 15% |
| Performance | 13% |
| Recoverability | 12% |
| Scalability | 7% |
Now that we have our first set of data to compare with, I went to the physical design and did the same, where each design design may or may not contribute to a design quality.
| Design Quality | Availability | Manageability | Performance | Recoverability | Security | Scalability |
| Totals | 49 | 65 | 32 | 40 | 48 | 53 |
| Physical Design Decisions | ||||||
| PDD001 | 1 | 1 | 1 | 0 | 1 | 1 |
| PDD002 | 1 | 1 | 1 | 1 | 1 | 1 |
| PDD003 | 0 | 1 | 0 | 1 | 1 | 0 |
| PDD004 | 1 | 1 | 1 | 1 | 1 | 1 |
| PDD005 | 1 | 0 | 1 | 1 | 1 | 1 |
| PDD006 | 1 | 1 | 1 | 1 | 1 | 1 |
| PDD007 | 1 | 1 | 1 | 1 | 1 | 1 |
| PDD008 | 1 | 1 | 1 | 1 | 1 | 1 |
| PDD009 | 1 | 1 | 1 | 1 | 1 | 1 |
| PDD010 | 0 | 1 | 0 | 0 | 1 | 1 |
| PDD011 | 1 | 1 | 1 | 1 | 1 | 1 |
| PDD012 | 0 | 1 | 0 | 0 | 1 | 1 |
| PDD013 | 1 | 1 | 0 | 1 | 1 | 1 |
| PDD014 | 1 | 1 | 1 | 0 | 0 | 1 |
| PDD015 | 1 | 1 | 0 | 1 | 0 | 0 |
| PDD016 | 1 | 1 | 0 | 1 | 1 | 1 |
| PDD017 | 1 | 1 | 0 | 0 | 0 | 1 |
| PDD018 | 0 | 1 | 0 | 0 | 0 | 1 |
| PDD019 | 0 | 1 | 0 | 0 | 0 | 1 |
| PDD020 | 1 | 1 | 1 | 0 | 0 | 1 |
| PDD021 | 1 | 1 | 0 | 1 | 0 | 0 |
| PDD022 | 1 | 1 | 0 | 1 | 1 | 1 |
| PDD023 | 1 | 1 | 0 | 0 | 1 | 0 |
| PDD024 | 0 | 1 | 0 | 0 | 0 | 1 |
| PDD025 | 0 | 1 | 0 | 0 | 0 | 1 |
| PDD026 | 1 | 1 | 1 | 0 | 0 | 1 |
| PDD027 | 1 | 1 | 1 | 0 | 1 | 1 |
| PDD028 | 1 | 1 | 1 | 1 | 1 | 1 |
| PDD029 | 1 | 1 | 0 | 1 | 1 | 1 |
| PDD030 | 1 | 1 | 1 | 1 | 1 | 0 |
| PDD031 | 1 | 1 | 1 | 1 | 1 | 1 |
| PDD032 | 1 | 1 | 1 | 0 | 0 | 1 |
| PDD033 | 1 | 1 | 1 | 0 | 1 | 1 |
| PDD034 | 1 | 1 | 1 | 1 | 1 | 1 |
| PDD035 | 1 | 1 | 0 | 1 | 1 | 1 |
| PDD036 | 1 | 1 | 1 | 1 | 1 | 1 |
| PDD037 | 1 | 1 | 1 | 1 | 1 | 1 |
| PDD038 | 1 | 0 | 1 | 0 | 0 | 1 |
| PDD039 | 1 | 0 | 1 | 0 | 0 | 1 |
| PDD040 | 0 | 0 | 1 | 1 | 0 | 1 |
| PDD041 | 1 | 1 | 0 | 1 | 1 | 1 |
| PDD042 | 1 | 1 | 0 | 1 | 1 | 0 |
| PDD043 | 0 | 0 | 0 | 0 | 1 | 0 |
| PDD044 | 0 | 0 | 0 | 0 | 1 | 0 |
| PDD045 | 1 | 0 | 0 | 1 | 0 | 1 |
| PDD046 | 1 | 1 | 0 | 1 | 0 | 1 |
| PDD047 | 1 | 1 | 1 | 1 | 1 | 1 |
| PDD048 | 1 | 1 | 1 | 1 | 1 | 1 |
| PDD049 | 1 | 1 | 1 | 1 | 1 | 1 |
| PDD050 | 1 | 1 | 1 | 1 | 1 | 1 |
| PDD051 | 1 | 1 | 1 | 0 | 1 | 0 |
| PDD052 | 1 | 1 | 0 | 0 | 0 | 0 |
| PDD053 | 0 | 1 | 0 | 0 | 0 | 1 |
| PDD054 | 1 | 1 | 1 | 1 | 1 | 1 |
| PDD055 | 1 | 1 | 0 | 0 | 1 | 1 |
| PDD056 | 0 | 1 | 0 | 1 | 1 | 1 |
| PDD057 | 0 | 1 | 0 | 1 | 1 | 1 |
| PDD058 | 1 | 1 | 0 | 1 | 1 | 1 |
| PDD059 | 1 | 1 | 1 | 1 | 1 | 1 |
| PDD060 | 0 | 1 | 0 | 0 | 0 | 0 |
| PDD061 | 1 | 0 | 0 | 0 | 0 | 1 |
| PDD062 | 0 | 0 | 1 | 0 | 0 | 0 |
| PDD063 | 1 | 1 | 0 | 1 | 1 | 0 |
| PDD064 | 0 | 1 | 0 | 1 | 1 | 1 |
| PDD065 | 0 | 1 | 0 | 1 | 1 | 1 |
| PDD066 | 1 | 1 | 0 | 0 | 1 | 1 |
| PDD067 | 0 | 1 | 0 | 0 | 1 | 0 |
| PDD068 | 0 | 1 | 0 | 0 | 1 | 0 |
| PDD069 | 0 | 1 | 0 | 0 | 0 | 0 |
| PDD070 | 0 | 1 | 0 | 0 | 1 | 0 |
| PDD071 | 0 | 1 | 0 | 0 | 0 | 0 |
| PDD072 | 0 | 1 | 0 | 0 | 0 | 0 |
| PDD073 | 0 | 1 | 0 | 0 | 0 | 0 |
| PDD074 | 0 | 1 | 0 | 1 | 0 | 0 |
Again, based on the totals I created a pie chart based on % measurement.
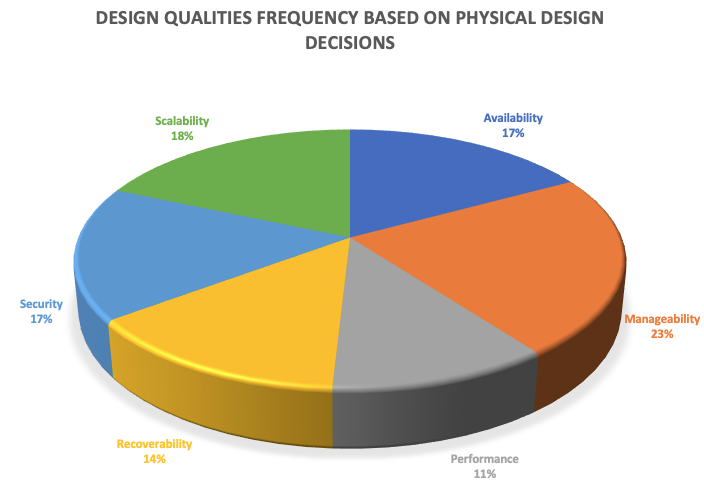
Now we have another set of results to compare with:
| Design Quality | Percentage [SOLUTION REQUIREMENTS] | Percentage [PHYSICAL DESIGN] | Percentage Difference PHY-REQ |
| Manageability | 28% | 23% | -5% |
| Availability | 25% | 17% | -8% |
| Security | 15% | 17% | +2% |
| Performance | 13% | 11% | -2% |
| Recoverability | 12% | 14% | +2% |
| Scalability | 7% | 18% | +11% |
| Totals | 100% | 100% | 0% |
So based on the results we are now able to spot the deviation between the conceptual design in terms of solution requirements and physical design decisions, and based on the data analysis, I believe as architects this would enable us to look back at the design document and verify whether:
- Verify why there is a deviation in a certain design quality because a single design decision can contribute to multiple design qualities.
- Be keen on the negative percentage difference and verify if the negative value would have in impact on the overall design and should be addressed in a better way.
Ultimately an architect would be able to have a data driven anchor to see if such a deviation is acceptable or not.
In summary, this process doesn’t evaluate the content of a design [because the architect is the most knowledgable about the technical aspect of a design decision] decision but rather focuses on producing data that can say something about the relation between the solution requirements and the physical design output.
I’d be very much interested in your thoughts and ideas around this topic and help produce more interesting data =).
Thank you,
(Abdullah)^2